

Impairment Investigation of Sand Run
The Background.
Sand Run, located roughly one mile upstream of the Thomas Reservoir dam in Tucker County (see fig. 1.), is listed as impaired for metals toxicity (iron and aluminum) and fecal coliform by the 2011 Cheat Total Maximum Daily Load (TMDL). It is of unique significance given both its status as the only Trout designated stream in the North Fork watershed and its status as the largest source of pollution – according to the TMDL – to the reservoir. While two abandoned mine lands refuse piles are located within the Sand Run watershed, one has been reclaimed and neither has been associated with acid mine drainage (AMD). Furthermore, three point source discharge permits once held by a limestone quarry located at the
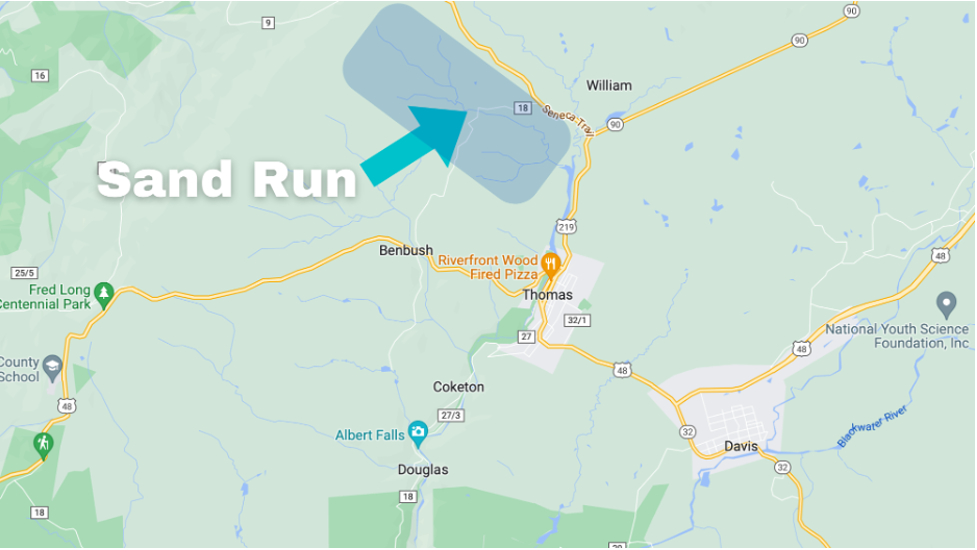
Figure 1. A map illustrating the location of Sand Run (click map to enlarge).
headwaters of Sand Run have been terminated since development of the TMDL. Given this, the present extent of metals toxicity is questionable. Regarding the Fecal Coliform and Bio impairments, the TMDL model attributes these to “inadequate onsite sewage systems” with excessive sediment deposition an additional contributing factor to the Bio listing. The validity of these conclusions have not been confirmed, however.
Our Investigation.
Sampling in the Sand Run watershed has proven more difficult than the other sampling locations where FOB monitors on Beaver Creek and the North Fork.
Quarterly testing of all FOB monitored sights occurred in September and December 2019, and March, June, September, and December 2020, and March 2021, including Sand Run. Four samplings during rain events have occurred. Lab results concur with our predictions that fecal coliform is likely coming from the community of Pierce, WV and that counts are higher during and immediately after rain events. Metal counts were low, if present. In addition to this, the pH was close to neutral, indicating there is no Acid Mine Drainage in Sand Run (see fig. 2.). Due to these findings, we focused our efforts on determining the level and source of fecal coliform in Sand Run.
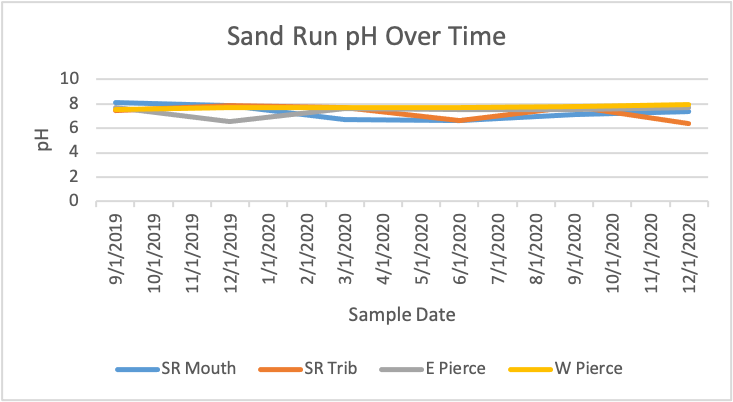
Figure 2. A line graph illustrating the pH of Sand Run at various locations from September 2019 to December 2021 (click graph to enlarge).
Our original fecal coliform testing protocol consisted of taking grab samples at the four sample sites along Sand Run and driving them to the Moorefield Department of Agriculture Lab for testing. Folks at this lab suggested we send off samples to have them source tracked in an attempt to determine if the contamination is human or animal caused (once it was already determined there was a fecal coliform contamination in Sand Run). We sent two grab samples, one upstream of the Pierce community and one downstream to EMSL Analytical Inc. to perform source tracking for total coliforms and fecal coliforms. The results were inconclusive. Due to this, FOB reached out for assistance on this project and got in contact with James Summers, Environmental Resource Analyst for the WVDEP. Mr. Summers then helped us create a plan to determine whether or not Sand Run is contaminated with fecal coliform bacteria over the allowable level for recreation and where it was entering the stream.
The new protocol consisted of one round of grab samples from Sand Run each week of May and the first week of June in 2022. We took one sample from downstream of the Pierce community, one from upstream of the Pierce community, and one from the mouth of Sand Run each round (see fig.3.). This came to a total of 15 samples over the month of May (and one in June). The samples were analyzed for fecal coliform. FOB reached out to the Moorefield Agricultural Lab to perform the analysis of these grab samples but they were unable to continue performing our testing, so we sent them to Standard Laboratories in Belington, WV. We chose this lab due to its proximity to our location in Thomas, WV and their status as a certified commercial lab. The samples were delivered to the lab immediately following each sample run by FOB Project Coordinator, Frank Gebhard.
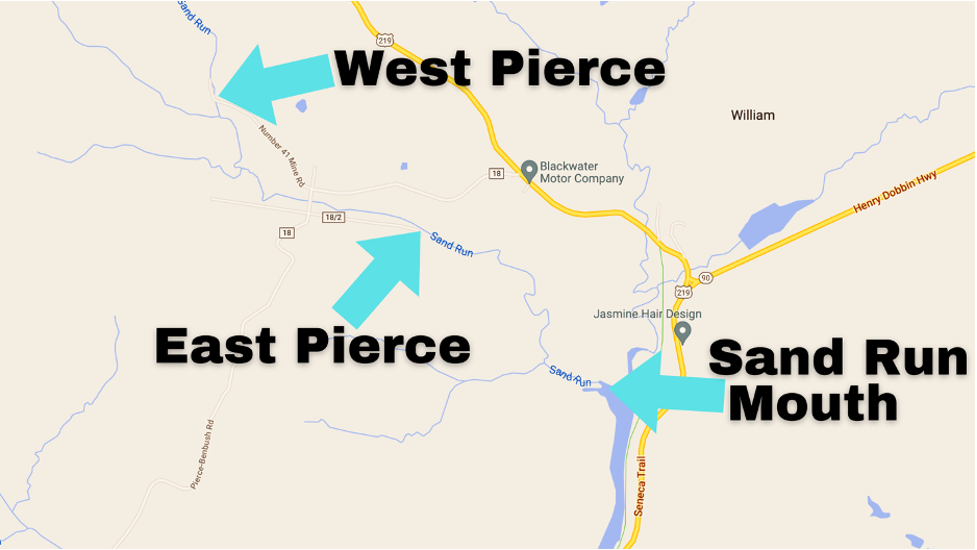
Figure 3. A map illustrating the locations of our improved testing protocol (click map to enlarge).
The Fruit of Our Labor.
Figure 4. illustrates the data acquired from our improved protocol that was used during May and June of 2022. These data proved more useful in determining the source and degree of fecal coliform contamination in Sand Run. The fecal coliform counts from the site upstream (West) of the Pierce community were consistently lower than the counts from the Mouth and the site downstream (East) of the Pierce community. This suggests that the contamination could be human-caused, entering from one or more leaking septic systems in the Pierce community. Another thing to note from these data is that the site upstream of Pierce did not exceed the allowable level of fecal coliform for recreation based on five sample events within a calendar month. The site downstream of Pierce and Sand Run Mouth fecal coliform counts did, however, exceed the allowable level of ~200cfu/100ml. That being said, we recommend against water contact recreation in and around the mouth of this stream until the issue has been resolved.

Figure 4. A bar graph illustrating the results of our improved testing protocol (click graph to enlarge).